 MA Audio Visualizer / Spectrum Analyzer
User Guide
A walkthrough of the screen layout, what each feature does, and what the settings mean. Come back here whenever something's unclear.
Contents
The basic screen
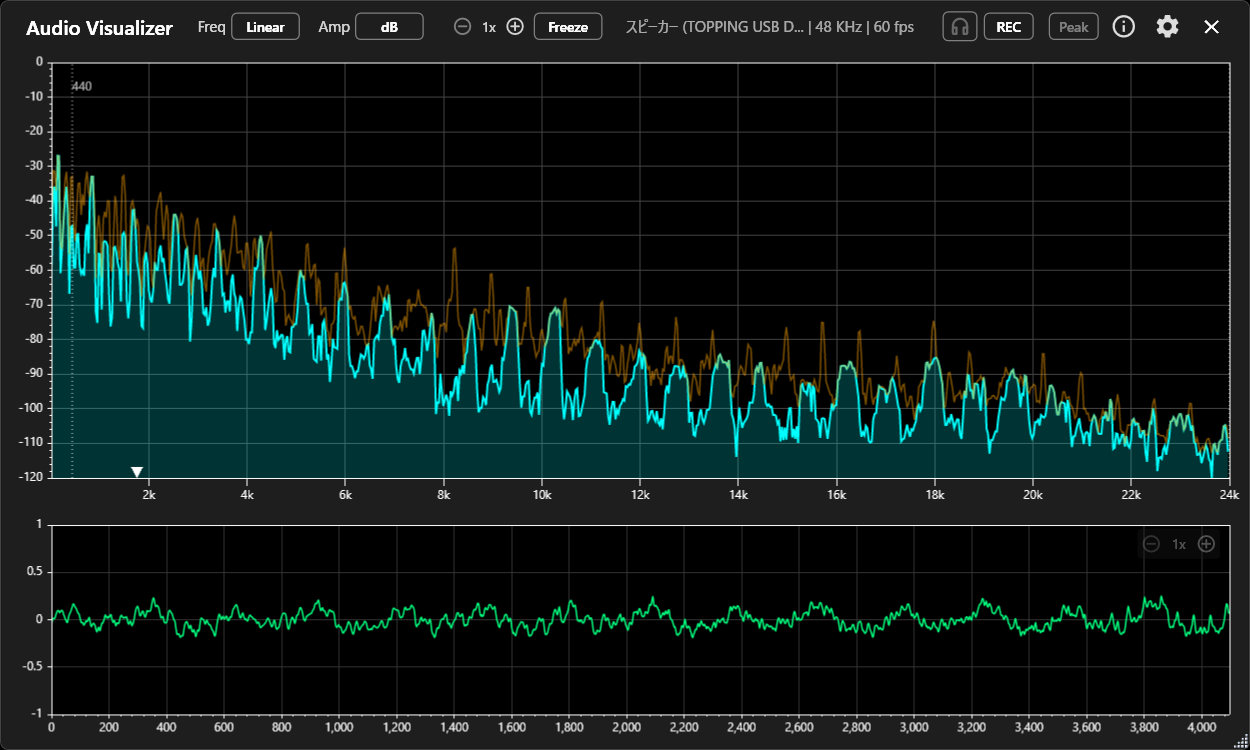
The top pane is the spectrum, the bottom pane is the waveform. The controls sit in the toolbar along the top. Match the numbers on the screenshot with the list below.
 1
2
3
4
5
6
7
8
9
10
11
12
13
14
1
2
3
4
5
6
7
8
9
10
11
12
13
14
Available in FreePro only
- Freq (frequency axis)Switch between Linear, Log and Piano. Linear shows frequency as-is, Log is a logarithmic view closer to how we hear, and Piano maps the axis to the piano's range (also logarithmic).
- Amp (amplitude axis)Switch between dB (logarithmic) and Linear. In Linear mode you can adjust the sensitivity in Settings.
- Spectrum zoomPROMagnifies the frequency axis (Pro). Once zoomed in, drag left and right to reach the band you want.
- FreezePauses the display and switches to Freeze mode, where the seek controls become available. It becomes [Live] — press again to return to real time.
- Input device infoShows the device being analysed, its sample rate and the frame rate.
- Monitor (headphones)Monitor the incoming audio through headphones or similar. Output device and volume are set in Settings.
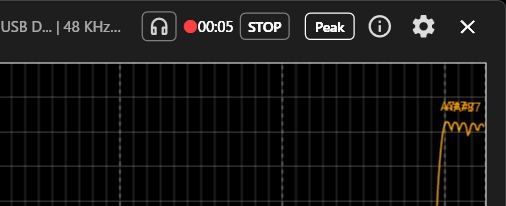
- REC (recording)PROSaves the incoming audio as WAV (Pro). Up to 15 minutes.
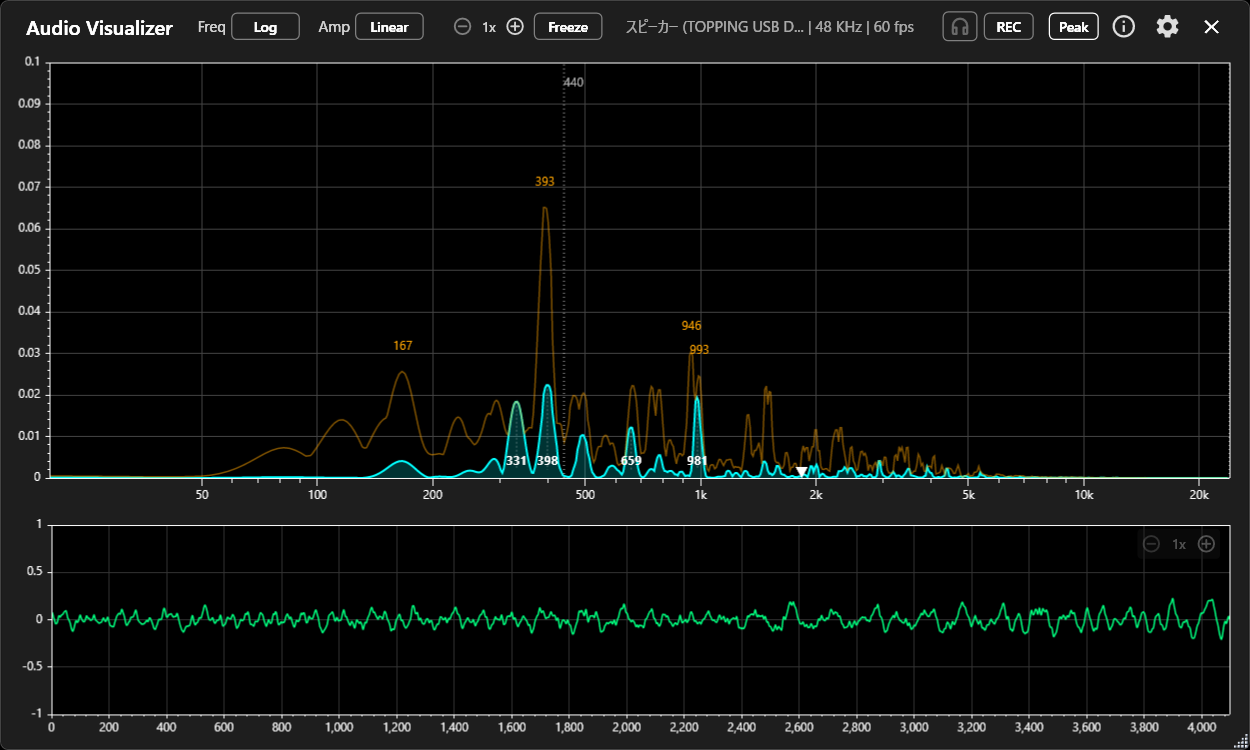
- PeakToggles peak labels. Up to four peaks are detected at a time.
- InfoOpens this manual in your browser.
- Settings (cog)Change the input device, resolution (FFT), colours, monitor output and other settings.
- Spectrum pane (top)Shows the sound by frequency — horizontal is frequency, vertical is level.
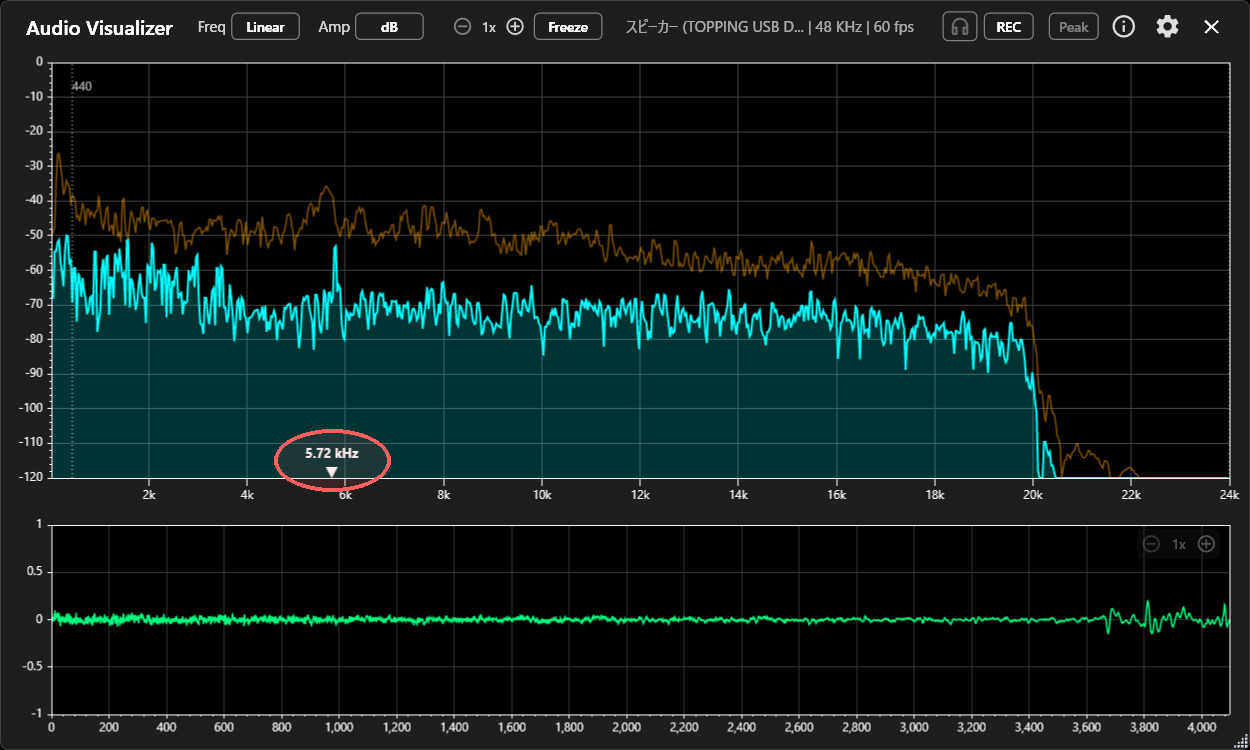
- Spectral centroid marker (▼)PROMarks where the sound's energy is centred (Pro) — a guide to its brightness. Hover to read the frequency.
- Waveform pane (bottom)Shows the raw waveform. In Pro, you can drag here while frozen to seek through time.
- Waveform zoom (vertical)PROChanges the maximum level of the waveform display so quiet sounds can be shown larger (Pro).
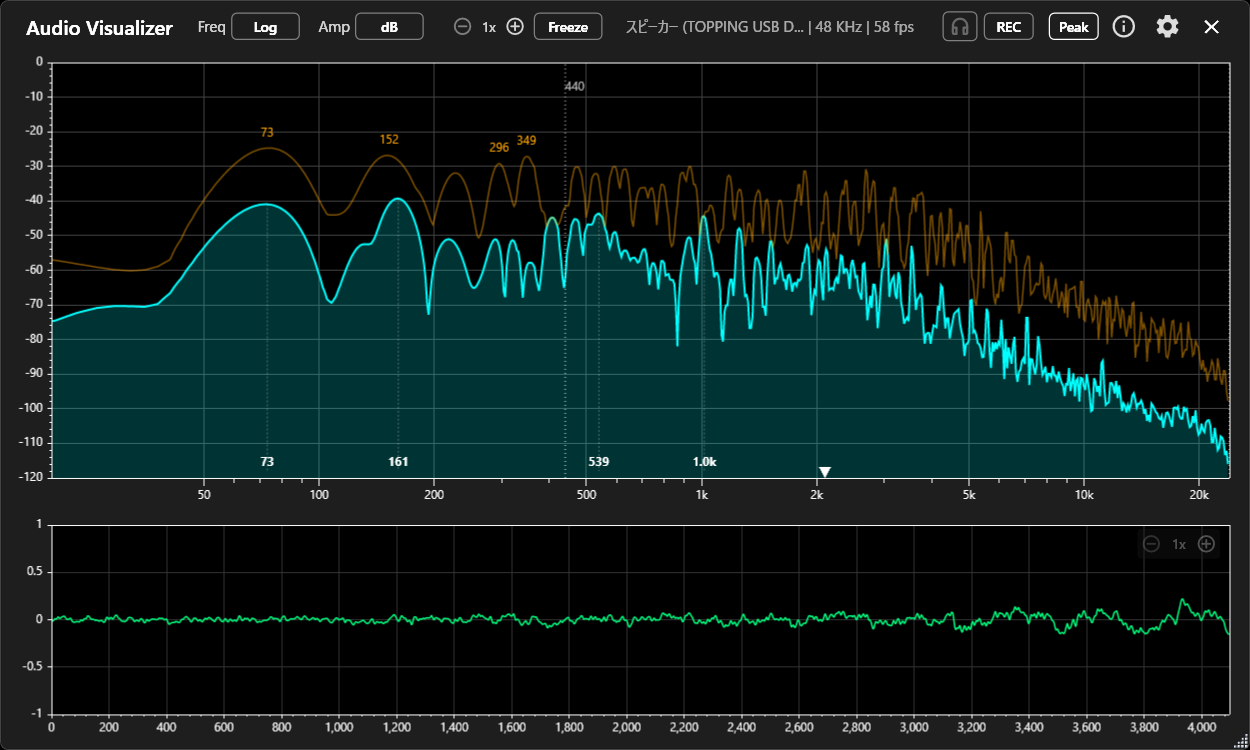
Frequency axis (Linear / Log / Piano)
- Linear: equal spacing across frequencies — good for viewing the physical frequency range directly.
- Log: expands the low end and compresses the highs — closer to how we actually hear, good for music and instruments.
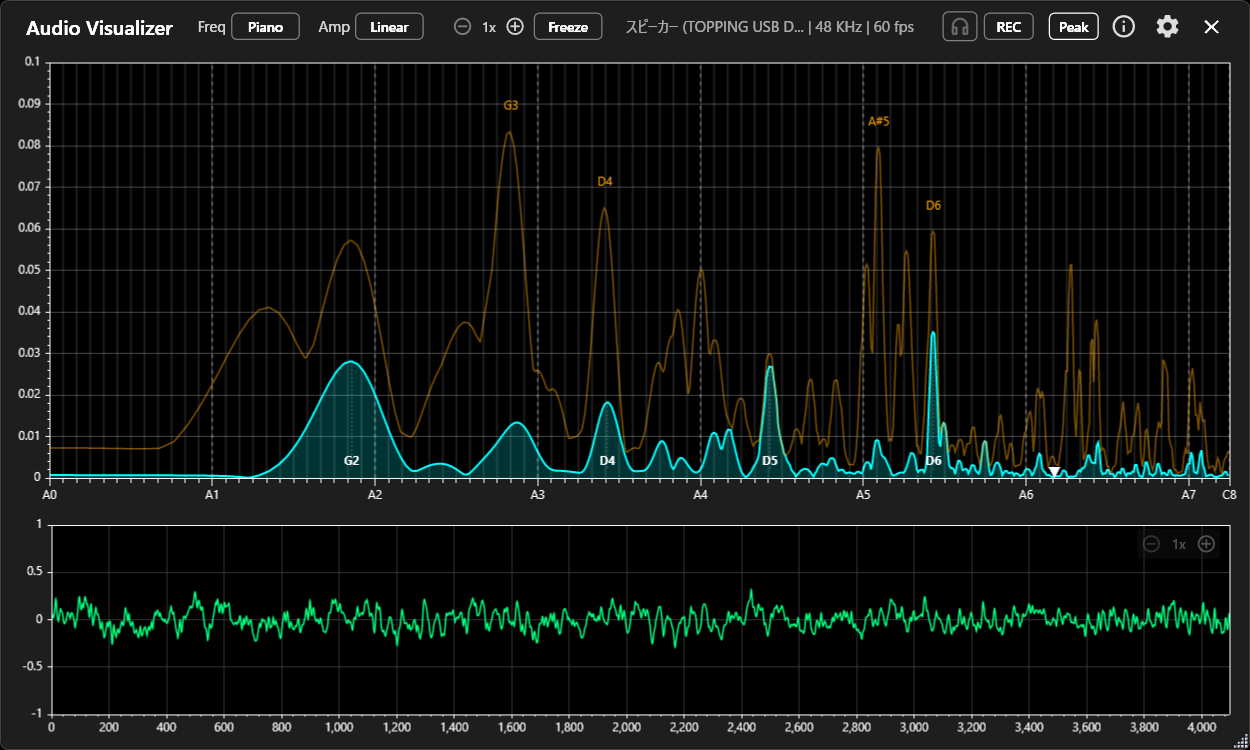
- Piano: laid out over the piano's note range. Peak labels can show note names too.
Amplitude axis (dB / Linear)
dB mode makes quiet components easy to see and is good for checking overall balance. Linear mode gives a more direct read on amplitude changes. The waveform pane below updates alongside it.
PROIn Linear mode, some sources can show only a very low peak. If that happens, raise the scale with "Amp Linear Max Lv." in Settings, or tick "Auto" to have it automatically adjust to match the loudest peak. Note: both of these only affect Linear mode — they have no effect in dB mode.
Peak labels & peak hold
Shows the peak (maximum) level for each frequency on the spectrum and holds it for a while. The [Peak] button at the top right finds up to four peaks at a time and labels them on both the live trace and the peak-hold trace. Double-click the spectrum to reset peak hold manually at that moment.
PROIn Pro you can toggle peak display, choose whether labels show the frequency, the value or both, customise how long peak hold is kept, and change the colour of the peak-hold line.
Monitor & Freeze
The [Headphone] button lets you monitor the incoming audio directly. The monitor output device and volume can be changed in Settings. Using speakers will cause feedback, so headphones are recommended (if the input source and the monitor output are the same device, monitoring is only available while frozen).
The Freeze button pauses the display so you can inspect it calmly. While frozen, hovering shows the frequency and level at that point, and you can still switch frequency/amplitude display modes. The peak hold from the moment you froze is kept as well, so you can review the most recent peak positions at your leisure.
Moving through time: while frozen, the << >> buttons step in 0.5-second increments and < > step frame by frame. ▶ plays forward and ◀ plays in reverse, so you can listen as you review. When playback is stopped and monitoring is on, the app loops the audio at that exact moment (1/10 second). In Pro, you can also drag the waveform at the bottom of the screen or spin the mouse wheel to move in 1/1000-second steps, and use the keyboard [←] [→] keys to move a single sample at a time — perfect for pinning down a momentary noise, click, or transient. History length goes back up to 5 seconds on Free, and up to 10 seconds on Pro.
While frozen, a [Live] button appears — press it any time to return to the real-time display.
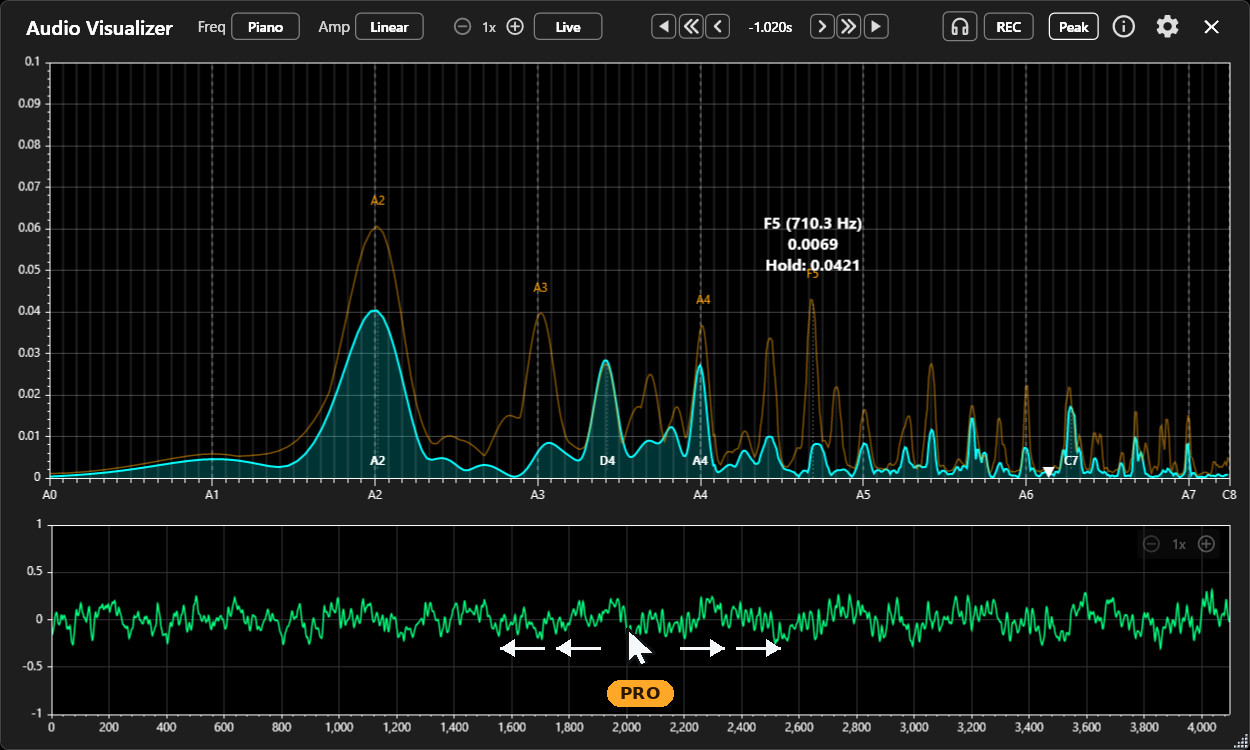
◀ << < / > >> ▶ move and play. Pro lets you drag the waveform below to seek finelySpectral centroid marker PRO
Show a marker for the spectral centroid on the spectrum — a handy indicator of the sound's "brightness" or balance point. The spectral centroid expresses, as a single frequency, where the sound's energy is concentrated (towards the low or high end). A higher value tends to mean a brighter sound, a lower value a darker, heavier one.
Hover over the marker to read the centroid frequency (Hz). It's a useful reference when comparing how bright different sources sound, or the character of different timbres. You can turn the marker on and off in Settings.
Line/Bar Style, Waveform Colour & Zoom PRO
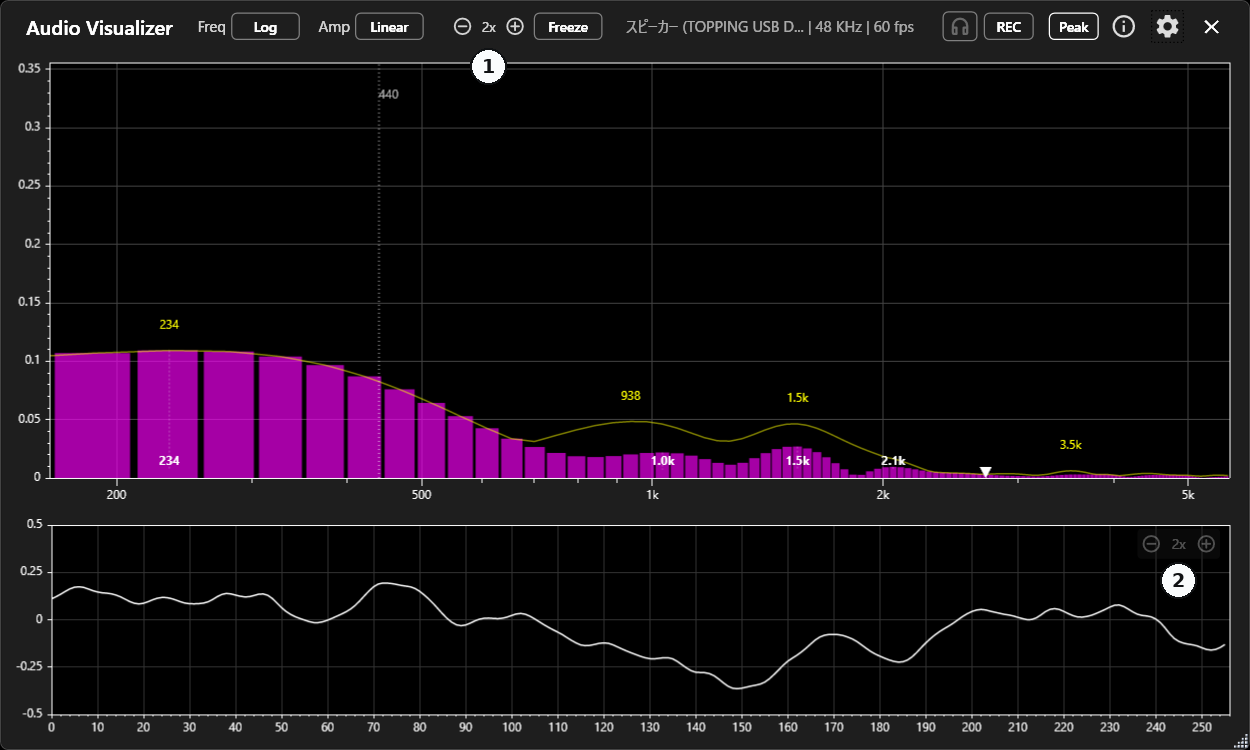
In Pro mode you can customise how everything is drawn. The spectrum can be switched between a smooth line view (good for overall trends) and a bar view that makes individual FFT components easier to read. The ⊖ 1x ⊕ control at ① along the top magnifies the spectrum along the frequency axis (horizontally) for a closer look. While zoomed in, drag with the mouse to move the visible range.
For the waveform pane at the bottom, the ⊖ 1x ⊕ control at ② (top right of the pane) magnifies the level (vertically). "Waveform Zoom" in Settings covers both that and the sample direction (time axis, horizontal). Zooming vertically reveals quiet sounds; zooming horizontally reveals the shape of a shorter time range.
The colours of the spectrum, the peak-hold line and the waveform can all be customised as well.
Recording PRO
The [REC] button at the top right saves the audio being analysed as a WAV file. It's limited to 15 minutes — meant for short test or reference captures rather than long recording sessions. Files go to the folder chosen under "Recording Folder" in Settings, and the elapsed time is shown on screen. Recording stops automatically at the 15-minute mark, or if the settings change.
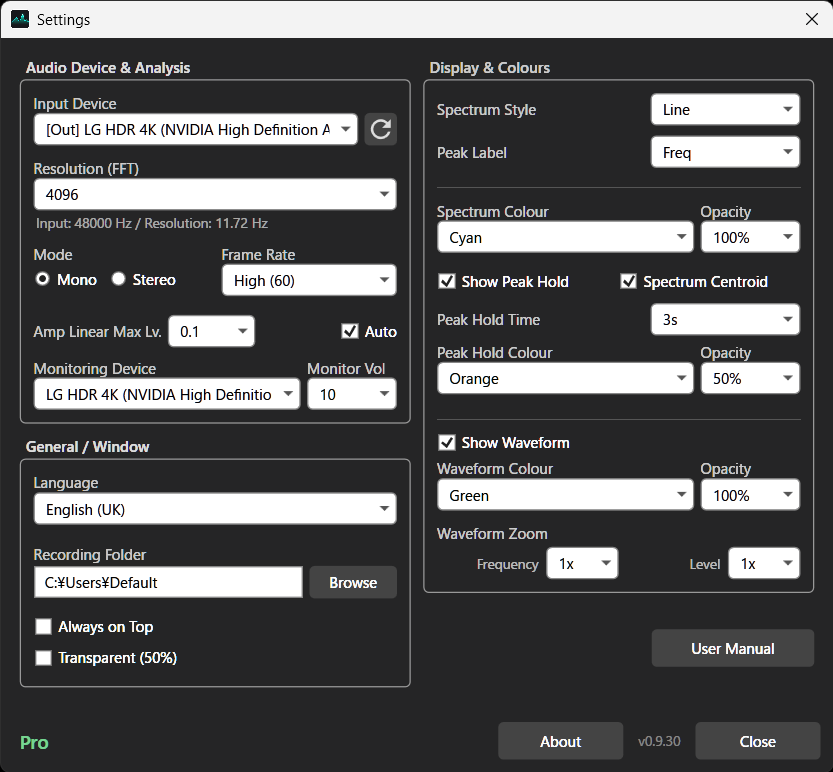
Settings reference
Everything in the Settings window, opened from the cog icon.
| Setting | Plan | What it does |
|---|---|---|
| Audio Device & Analysis | ||
| Input Device | Free | The audio source to analyse. Entries starting with [Out] are playback devices — pick one to watch music or video playing on your PC. Entries starting with [In] are inputs such as microphones The circular arrow on the right reloads the list — press it after changing device settings in the OS, plugging or unplugging headphones, or connecting something over Bluetooth |
| Resolution (FFT) | Partly Pro | Sets how finely the frequency range is divided. Choose from 256 / 512 / 1024 / 2048 / 4096 — Pro adds 8192 / 16384 / 32768 Higher values split the frequency range more finely The input sample rate and the resulting resolution per bin (Hz) are shown just below |
| Mode (Mono / Stereo) | Free | By default the two channels are mixed down to mono. Choose Stereo and the display splits into two, one for each channel |
| Frame Rate | Pro | The display refresh rate is fixed at 20 per second on Free; Pro lets you choose 20 or 60. |
| Amp Linear Max Lv. / Auto | Pro | Changes the top of the vertical scale when the amplitude axis is set to Linear. Tick Auto and it follows the loudest peak automatically. Note: this has no effect while Amp is set to dB |
| Monitoring Device / Monitor Volume | Free | Sets which device the [Headphone] monitor plays through, and at what volume. Headphones are recommended to avoid feedback. If you pick the same device as the input source, monitoring only works while frozen |
| General / Window | ||
| Language | Free | Choose the language used throughout the app. |
| Recording Folder | Pro | Where WAV files recorded with [REC] are saved |
| Always on Top | Pro | Keeps the window above other applications |
| Transparent (50%) | Pro | Makes the background semi-transparent — handy for overlaying it on a DAW, a video, or a streaming layout |
| Display & Colours | ||
| Spectrum Style | Pro | Sets how the spectrum is drawn — a smooth Line, or Bars that let you read each FFT component |
| Peak Label | Pro | What the peak labels show — frequency, value, or both (plus note names in Piano mode) |
| Spectrum Colour / Opacity | Pro | Colour and opacity of the spectrum |
| Show Peak Hold | Pro | Whether the peak-hold trace is drawn |
| Spectrum Centroid | Pro | Whether the spectral centroid marker (▼) is shown |
| Peak Hold Time | Pro | How long peaks are held (1s / 3s / 5s / 10s / 30s / Infinite). Double-click the spectrum to reset manually |
| Peak Hold Colour / Opacity | Pro | Colour and opacity of the peak-hold trace |
| Show Waveform | Pro | Whether the waveform pane at the bottom is shown |
| Waveform Colour / Opacity | Pro | Colour and opacity of the waveform |
| Waveform Zoom (Frequency / Level) | Pro | Zoom for the waveform pane. Frequency is horizontal (time axis) and Level is vertical (amplitude). Level can also be changed from the ⊖ 1x ⊕ control at the top right of the waveform pane |
Free / Pro
Even with just the Free version, you get the core features — the real-time spectrum, the waveform display and peak detection.
Upgrading to Pro adds smoother rendering, finer analysis and display customisation. You can purchase it from the "Upgrade to Pro" button in Settings.
- Graphs are drawn at a smooth 60 FPS
- Higher FFT resolutions (8192, 16384, 32768) let you inspect the lower part of the audible range in much finer detail
- In Amp Linear mode — handy for pitch analysis — you can change the top of the scale so quiet sounds are easier to read
- Seek in 1 ms or single-sample steps while frozen, for much closer analysis
- Zoom into a frequency band on the spectrum, or into the waveform, to examine a sound closely
- Record the audio you're analysing and keep it for later
- Customise the display and set the colours to your liking
- Always-on-top and a transparent background let you overlay it on another app or a game and follow the sound visually
FAQ
- The frame rate is lower than what I set
- 60fps display and high FFT resolutions increase processing load. Depending on your PC, input device, other running apps, and display settings, the actual rendering rate can drop below what's selected.
- Is there a limit on recording length?
- Recording is capped at 15 minutes and stops automatically at that point. It's designed for short test/reference captures, not long-form recording.
- Is my audio data sent anywhere?
- No. All analysis happens locally, and audio data is never sent to an external server. Recorded files are saved to a folder you choose.
- Can I use this as a calibrated measurement instrument?
- This app is a visual inspection tool, not a calibrated measurement instrument. It's not intended for legal, professional, or certification-grade acoustic measurement. Displayed values are affected by your input device, OS volume settings, and environment.